Another Paul Scott’s company is headed to the Junior Market and will bring the total companies listed to 9, these include Seprod, Caribbean Producers, General Accident, AS Brydens and Sons, Eppley, Epply Caribbean Property Fund, Productivity Business Solutions and Stanley Motta. Scott also has a significant interest in Lumber Depot and Transjamaican Highway in which Musson owns over 595 million shares and is the third largest shareholder.
 Atlantic Hardware & Plumbing Company, a 30-year-old wholesale distribution company is offering 499,999,800 shares at $1 each for subscription. Just 200 million will be available to the public as JMMB Group is set to convert loans into shares. The shares are slated to be listed on the Junior Market of the Jamaica Stock Exchange. The company with a staff complement of 35 is located at 105-107 Marcus Garvey Drive. The issued share capital is currently 1.95 billion ordinary units. Construct Group owns 975 million units, Lumber Depot 682.5 million units and General Accident 292.5 million shares. The offer opens on the 27th of February and is scheduled to close on the 13th of March and will most likely close well ahead of the closing date, with only 100 million available for the general public.
The lead broker is JMMB Securities, an affiliate, the holder of a convertible bond, is entitled to exercise the conversion option for up to 300 million shares at $1 per share.
The net proceeds of $470 million will be used to repay debt, this includes the conversion of JMMB convertible bond representing 300 million units.
At the end of September last year borrowed funds surged to $1.34 billion compared to just $177 million at the end of 2023 as the company embarked on a share buyback, in a classic engineering exercise to get it to fit into the Junior Market capital size.
 Revenues in 2023 amounted to $1.4 billion with a profit of $147 million before tax. Revenues declined from the 2021 and 2022 levels of $1.67 billion with profit before tax of $318 million and $290 million respectively. Revenues of $440 million were generated in the September quarter up 30 percent from $339 million in 2023 and for the nine months to September, revenues climbed by 12 percent to $1.23 billion from $1.1 billion in 2023. Profit for the quarter before taxation was $18.7 million versus $69 million and for the year to September 2024 – $84 million compared with $236 million in 2023.
In January, this year, Atlantic sold real property on Ashenheim Road in Kingston. The net sale proceeds will be used to repay approximately $230 million of existing indebtedness. Borrowed funds should fall to around $200 million from the combination of the IPO proceeds and internal funds. Accordingly, interest cost that was $48 million in the September quarter should drop around $20 million annually.
The PE ratio works out at 12.5 times earnings which is unlikely to move the stock much with the market average currently around 13 but there several that are trading above 15. This is not one those companies that has a great future ahead of it and most investors should look elsewhere for better prospects.
 The market closed with an exchange of 186,609 shares for US$46,047 compared to 560,085 units at US$19,785 on Wednesday.
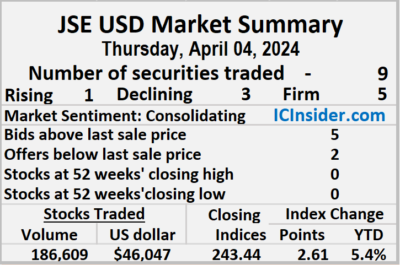 Sygnus Credit Investments shed 0.7 of one cent in closing at 7.3 US cents, following 51,168 units changing hands and Transjamaican Highway declined 0.02 of a cent to close at 2.18 US cents with a transfer of 2,375 shares.
 AS Bryden
 The market’s PE ratio, the most popular measure used to determine the value of stocks, ended at 21.7 on 2022-23 earnings and 11.8 times those for 2023-24 at the close of trading. ICInsider.com PE ratio chart and the more detailed daily charts provide investors with regularly updated information to help decision-making.
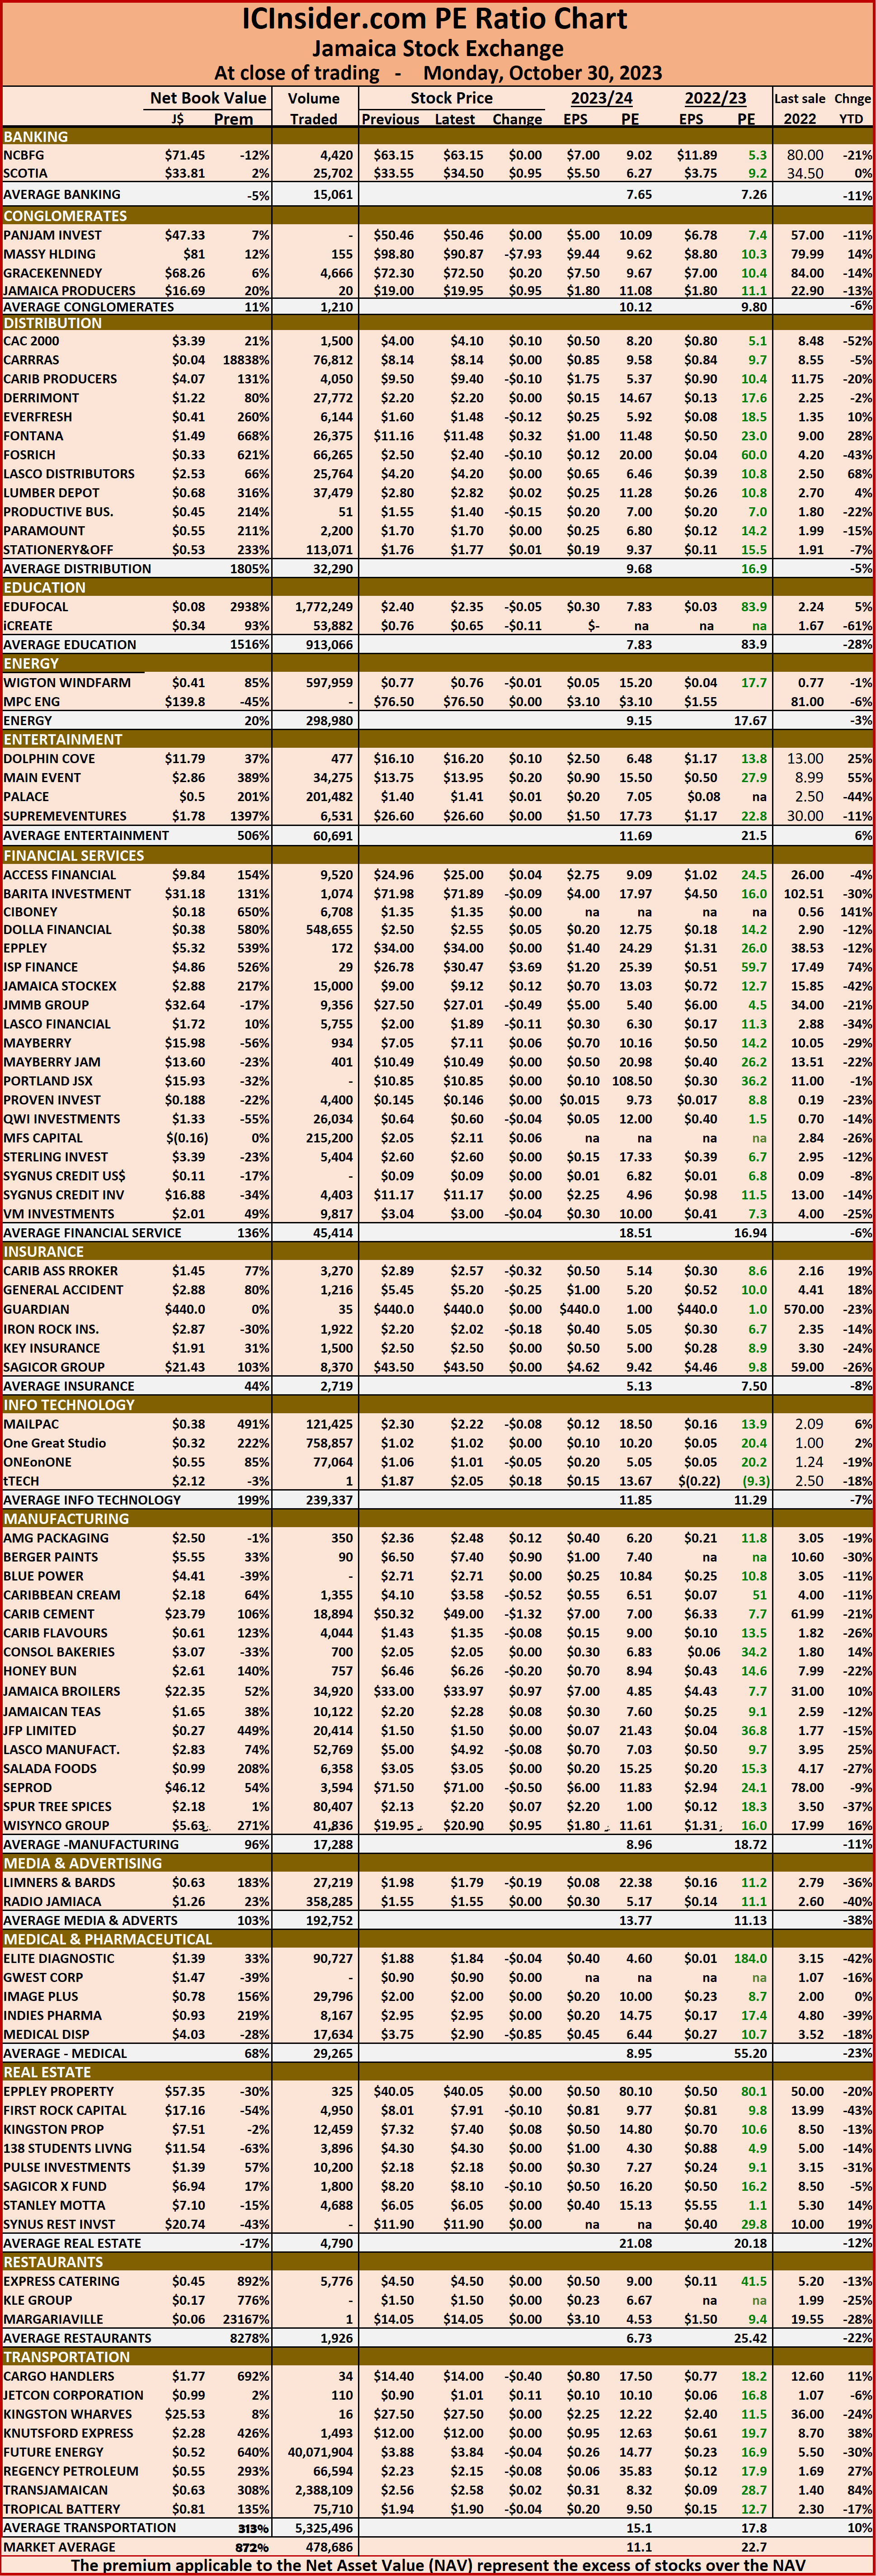
 The net asset value of each company is reported as a guide to quickly assess the value of stocks based on this measure. The chart also shows daily changes in stock prices and the percentage year to date price movement based on the last traded prices.
 At the close of Thursday’s trading, the JSE Combined Market Index slipped 326.84 points to close at 327534.33, while the All Jamaican Composite Index lost 930.59 points to conclude trading at 349,141.60, the JSE Main Index dropped 521.94 points to 313,565.25. The Junior Market Index rose 18.08 points to close trading at 3,820.10 and the JSE USD Market Index inched 0.33 points higher to 227.49.
 The market’s PE ratio, the most popular measure used to determine the value of stocks, ended at 22 on 2022-23 earnings and 11.6 times those for 2023-24 at the close of trading. ICInsider.com PE ratio chart and the more detailed daily charts provide investors with regularly updated information to help decision-making.
 Investors who buy when the price of a stock is close to the average will find that they are not inclined to overpay for a stock.
 At the close of trading on Wednesday, the JSE Combined Market Index rallied 1,728.93 points to 327,861.17, the All Jamaican Composite Index popped 4,070.89 points to finish at 350,072.19, while the JSE Main Index jumped 2,220.52 points to settle at 314,087.19. The Junior Market Index dropped 39.04 points to 3,802.02, even as trading picked up in this market and the JSE USD Market Index dropped 4.69 points to 227.16.
 The market’s PE ratio, the most popular measure used to determine the value of stocks, ended at 22.4 on 2022-23 earnings and 11.8 times those for 2023-24 at the close of trading. ICInsider.com PE ratio chart and the more detailed daily charts provide investors with regularly updated information to help decision-making.
 The net asset value of each company is reported as a guide to quickly assess the value of stocks based on this measure. The chart also shows daily changes in stock prices and the percentage year to date price movement based on the last traded prices.
 At the close of the market, the JSE Combined Market Index increased by 1,106.75 points to close at 326,132.24, while the All Jamaican Composite Index rallied 342.51 points to close at 346,001.30, the JSE Main Index rose 1,171.68 points to end at 311,866.67. The Junior Market Index closed marginally higher, with a rise of just 1.39 points to 3,841.06 and the JSE USD Market Index popped 1.16 points to 231.95.
 The market’s PE ratio, the most popular measure used to determine the value of stocks, ended at 22.1 on 2022-23 earnings and 11.8 times those for 2023-24 at the close of trading. ICInsider.com PE ratio chart and the more detailed daily charts provide investors with regularly updated information to help decision-making.
 The net asset value of each company is reported as a guide to quickly assess the value of stocks based on this measure. The chart also shows daily changes in stock prices and the percentage year to date price movement based on the last traded prices.
 At the close of trading on Monday, the JSE Combined Market Index dropped 2,329.48 points to 325,025.49, while the All Jamaican Composite Index declined 2,074.28 points to close trading at 345,658.79, the JSE Main Index skidded 2,171.72 points to settle at 310,694.99. The Junior Market Index fell 33.28 points to 3,839.90 and the JSE USD Market Index dropped 0.60 points to 230.39.
 The market’s PE ratio, the most popular measure used to determine the value of stocks, ended at 22.6 on 2022-23 earnings and 11.8 times those for 2023-24 at the close of trading. ICInsider.com PE ratio chart and the more detailed daily charts provide investors with regularly updated information to help decision-making.
 The net asset value of each company is reported as a guide to quickly assess the value of stocks based on this measure. The chart also shows daily changes in stock prices and the percentage year to date price movement based on the last traded prices.
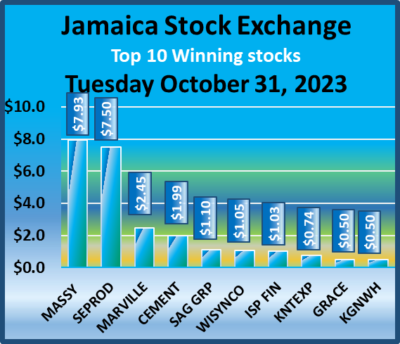 At close, the JSE Combined Market Index popped 4,618.54 points to close at 332,815.38, the All Jamaican Composite Index surged 4,665.94 points to 351,476.39, the JSE Main Index rallied 4,914.30 points to end October at 318,800.82. The Junior Market Index rose 2.26 points to close at 3,862.87 and the JSE USD Market Index climbed 12.75 points to close out October at 226.08.
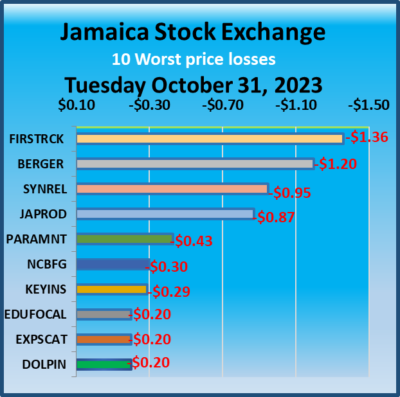 The market’s PE ratio, the most popular measure used to determine the value of stocks, ended at 22.5 on 2022-23 earnings and 11.2 times those for 2023-24 at the close of trading. ICInsider.com PE ratio chart and the more detailed daily charts provide investors with regularly updated information to help decision-making.
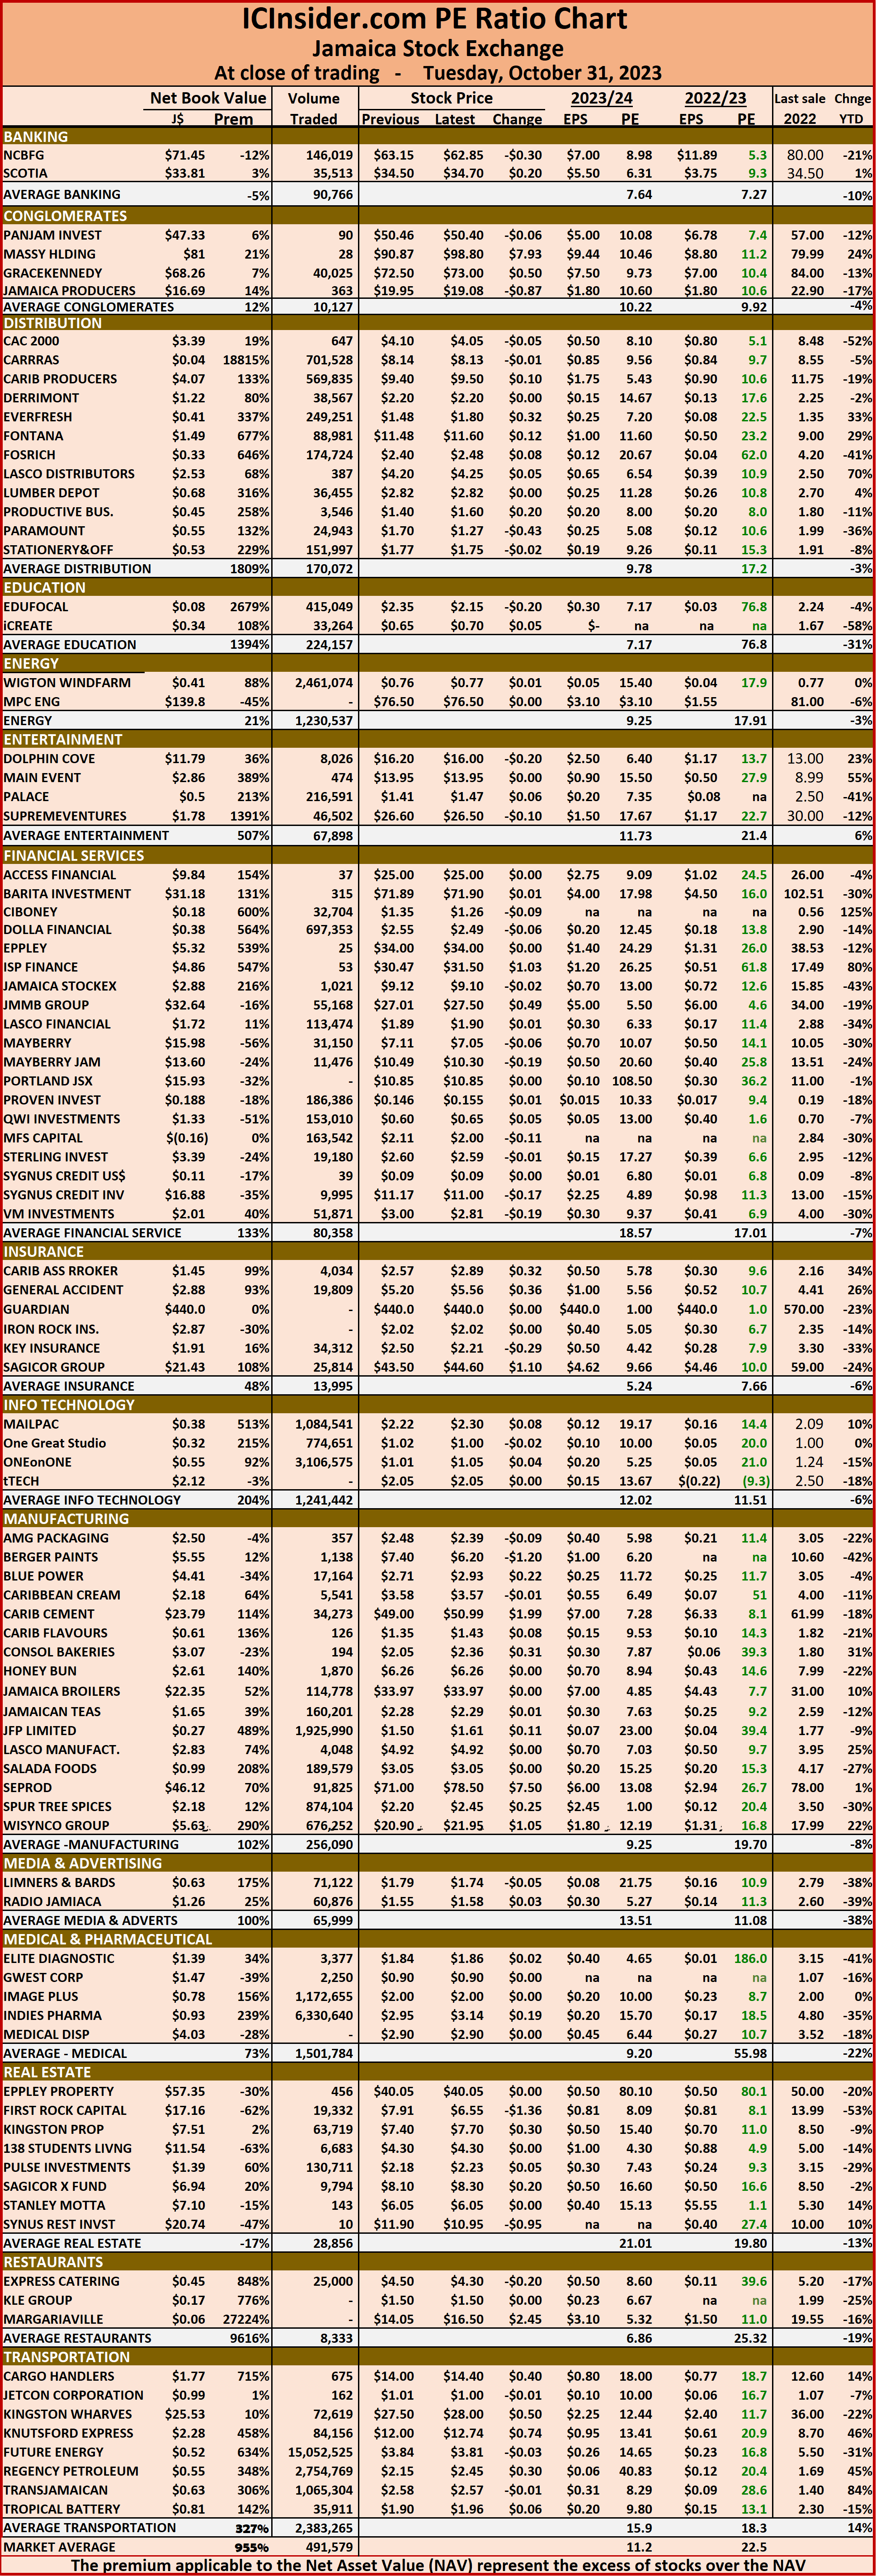 The net asset value of each company is reported as a guide to quickly assess the value of stocks based on this measure. The chart also shows daily changes in stock prices and the percentage year to date price movement based on the last traded prices.
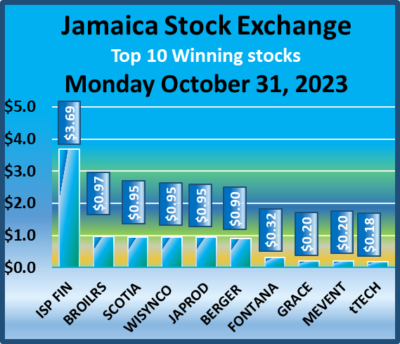 At close, the JSE Combined Market Index dropped 1,952.40 points to 328,196.84, while the All Jamaican Composite Index slipped 9.86 points to end at 346,810.45, the JSE Main Index dropped 1,512.64 points to 313,886.52. The Junior Market Index dived 60.10 points to 3,860.61 and the JSE USD Market Index declined 12.69 points to conclude trading at 213.33.
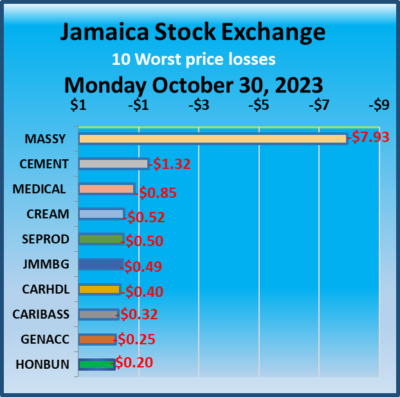 The market’s PE ratio, the most popular measure used to determine the value of stocks, ended at 22.7 on 2022-23 earnings and 11.1 times those for 2023-24 at the close of trading. ICInsider.com PE ratio chart and the more detailed daily charts provide investors with regularly updated information to help decision-making.
 This approach helps to remove emotions from investment decisions and place them on fundamentals while at the same time not being too far from the majority of investors. Investors who buy when the price of a stock is close to the average will find that they are not inclined to overpay for a stock.
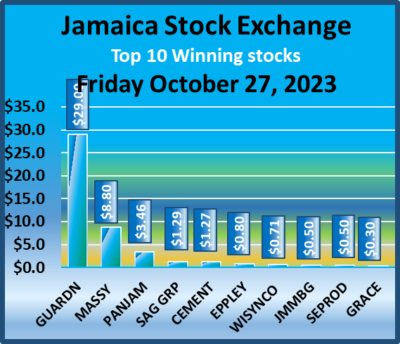 At close, the JSE Combined Market Index added 3,257.76 points to close at 330,149.24, while the All Jamaican Composite Index popped 168.58 points to settle at 346,820.31, the JSE Main Index increased 3,589.20 points to 315,399.16. The Junior Market Index slipped 11.26 points to 3,920.71 and the JSE USD Market Index rose 0.42 points to settle at 226.02.
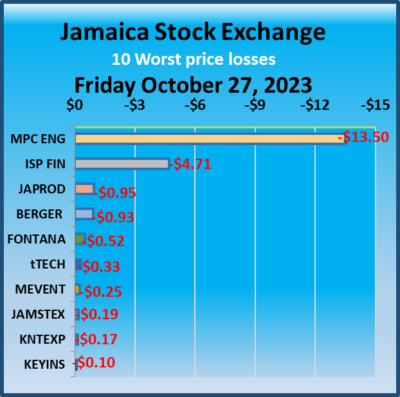 The market’s PE ratio, the most popular measure used to determine the value of stocks, ended at 23.1 on 2022-23 earnings and 11.2 times those for 2023-24 at the close of trading. ICInsider.com PE ratio chart and the more detailed daily charts provide investors with regularly updated information to help decision-making.
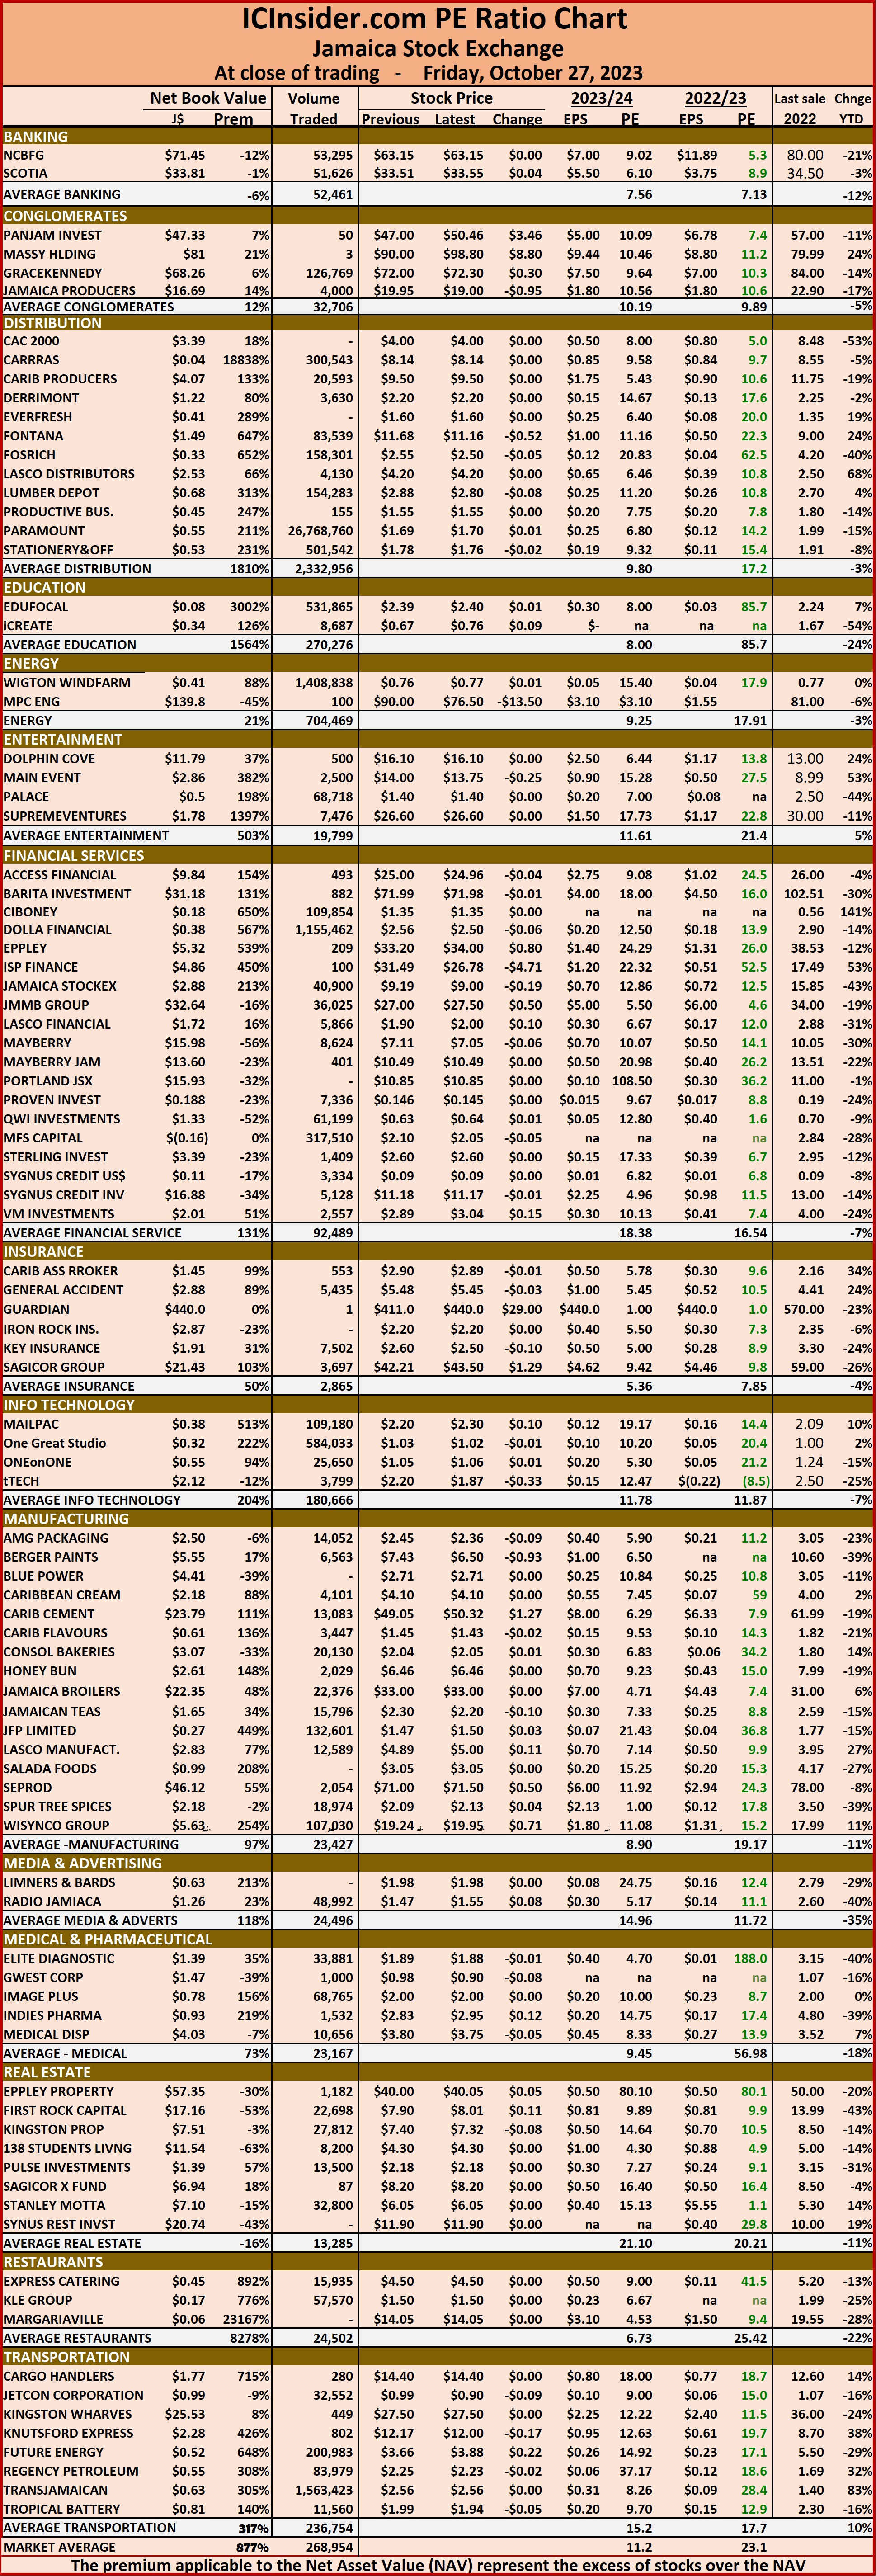 The net asset value of each company is reported as a guide to assess the value of stocks based on this measure quickly. The chart also shows daily changes in stock prices and the percentage year to date price movement based on the last traded prices.