Investors can trade shares either by using fundamental analysis, the more common method, or technical analysis. Both have their place, but technical analysis informs investors ahead of significant market moves and thus reduces the time one has to buy or sell a stock.
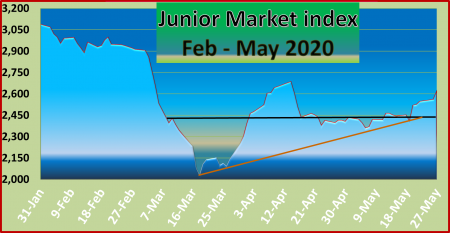
The triangular formation is shown by the black and golden lines.
The Junior Market suffered a sizable fall from its peak of 3,436 points in September last year to Mid-March and bounced sharply in the first two weeks in April, then retreated until-Mid May from which it started a rebound.
The market was recently in a triangular formation and is breaking higher as the formation suggests. Ascending triangle patterns are bullish, meaning that they indicate that a security’s price is likely to climb higher as the pattern completes itself. Two trendlines form the pattern, the first is flat along the top of the triangle and acts as a resistance point which—after price successfully breaks above it—signals the resumption or beginning of an uptrend. The second the bottom trendline of the triangle that shows price support—is a line of ascension formed by a series of higher lows. It is this configuration, formed by higher lows that forms the triangle and gives it a bullish characterization as each time sellers attempt to push prices lower, they are increasingly less successful.
The Junior Market has broken to the upside of the triangle, an indication of the rising market ahead. A critical factor behind this is the low PE ratio for Junior Market stocks at 9.3 versus Main market stocks of 15 as well as the fact that the average PE of Junior Market stocks had reached 15 times 2019 earnings.