Market activity ended on Tuesday, with the stock volume slipping mildly after the value declined 22 percent from Monday’s trade on the Jamaica Stock Exchange Main Market as falling stocks exceeded those gaining, but the market index rose.
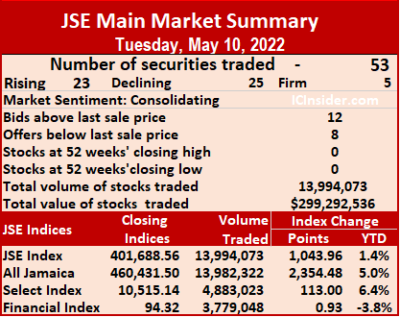
 The All Jamaican Composite Index gained 2,354.48 points to settle at 460,431.50, the JSE Main Index added 1,043.96 points to end at 401,688.56 and the JSE Financial Index popped 0.93 points to settle at 94.32.
Trading ended with 53 securities compared to 59 on Monday, with 23 rising, 25 declining and five ending unchanged.
The PE Ratio, a formula for computing appropriate stock values, averages 14.8. The JSE Main and USD Market PE ratios are computed based on ICInsider.com’s forecasted earnings for companies with financial years ending up to the close of August 2023.
Overall, 13,994,073 shares were exchanged for $299,292,536 versus 14,230,271 units at $381,343,934 on Monday. Transjamaican Highway led trading with 2.10 million shares for 15 percent of total volume followed by QWI Investments with 2.07 million units for 14.8 percent of the day’s trade, Sagicor Select Financial Fund chipped in with 1.98 million units for 14.1 percent market share and GraceKennedy, 1.83 million units for 13.1 percent market share.
Trading averages 264,039 units at $5,647,029, compared to 241,191 shares at $6,463,457 on Monday and month to date, an average of 226,911 units at $4,424,476, compared to 221,174 units at $4,235,568 on the previous trading day. April closed with an average of 532,209 units at $5,709,319.
Investor’s Choice bid-offer indicator shows 12 stocks ended with bids higher than their last selling prices and eight stocks with lower offers.
 At the close, Caribbean Cement dropped $1.50 ending at $66.50 in switching ownership of 46,616 shares, Eppley fell $1.96 in closing at $50.50 after 326 stock units were traded, Eppley Caribbean Property Fund shed $8.99 to close at $40 in an exchange of 320 units. GraceKennedy advanced $4 to end at $114 after exchanging 1,834,021 stocks, Guardian Holdings dipped $9.99 to $510.01 in exchanging 1,285 stocks, Jamaica Broilers lost 30 cents in closing at $28.50 after clearing the market with 3,910 shares. Jamaica Producers shed $1.25 to $22.60, trading 882 stock units, JMMB Group rallied 49 cents to end at $47.49 after 190,395 units passed through the market, Massy Holdings dropped 93 cents ending to $98.05 with the swapping of 10,146 shares. Mayberry Jamaican Equities declined 98 cents to close at $15.01 in trading 55,035 stocks, NCB Financial popped $10.25 to $116.90, with 122,398 stock units changing hands, 138 Student Living increased $1.20 to close at $5.25 in trading 97,496 units. Palace Amusement rose $10 in closing at $960 with an exchange of 156 units,PanJam Investment lost 50 cents to end at $66, with 44,331 stock units crossing the exchange, Proven Investments gained 43 cents to end at $37.98 after 80,732 stocks crossed the market. Sagicor Group climbed $2 in closing at $57 while exchanging 1,433 shares, Seprod fell 80 cents to end at $73 in an exchange of 55,933 stock units, Supreme Ventures lost 49 cents in ending at $31 while exchanging 88,113 stocks.
 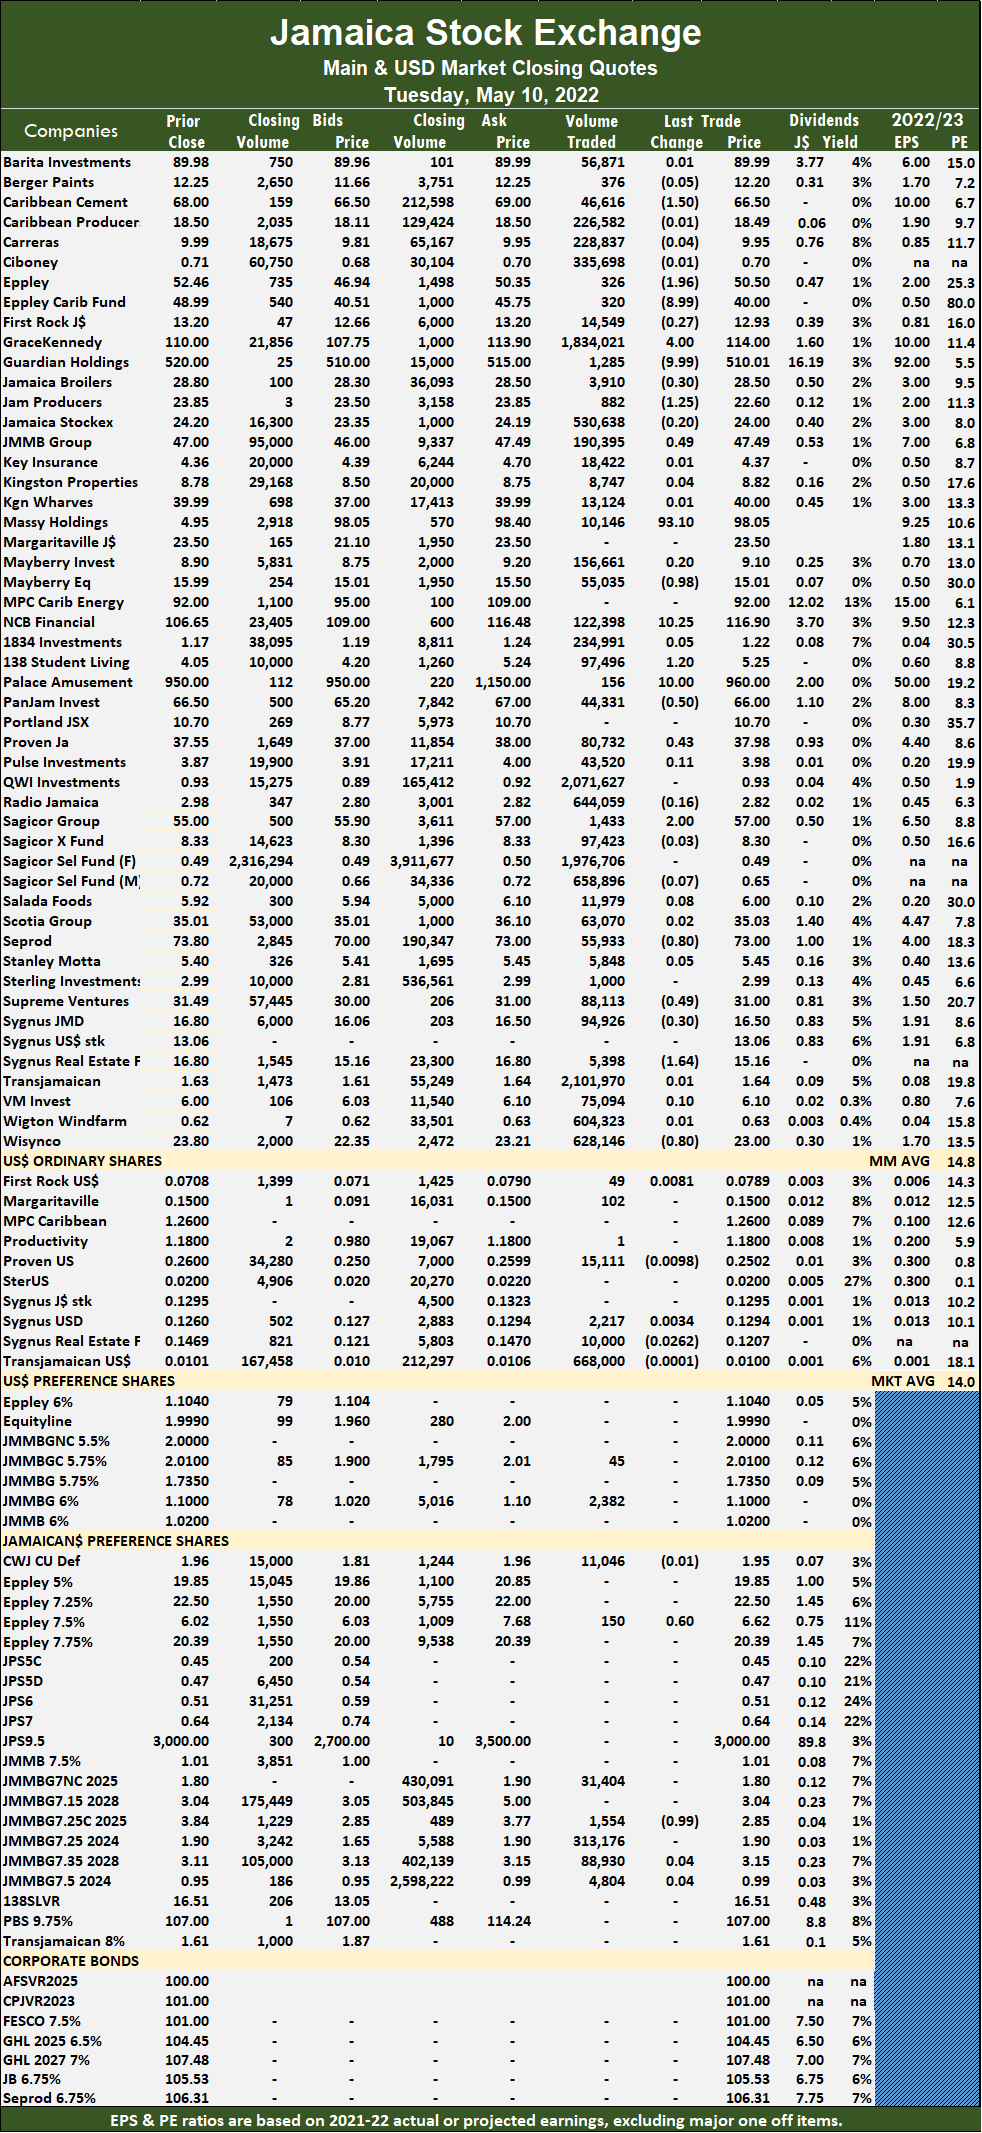 Sygnus Credit Investments fell 30 cents to close at $16.50 with the swapping of 94,926 shares, Sygnus Real Estate Finance shed $1.64 to $15.16 after finishing trading of 5,398 units and Wisynco Group declined 80 cents to end at $23 after exchanging 628,146 shares.
In the preference segment, Eppley 7.50% preference share climbed 60 cents to $6.62, with 150 stock units crossing the market and JMMB Group 7.25% preference share dropped 99 cents to close at $2.85 in trading 1,554 stock units.
Prices of securities trading are those for the last transaction of each stock unless otherwise stated.
Junior Market falls, Main Market rises
Investors pushed the Junior Market index up to a record intraday high of 4,669.78 in early trading on Tuesday, but the market failed to hold on to the positive gains and closed 21.62 points lower than Monday at 4,560.79. The Jamaica Stock Exchange Main Market enjoyed a modest rise and US dollar market experienced moderate slippage, with the JSE Combined Index gaining 785.38 points to close at 416,566.94.
 The All Jamaican Composite Index rose 2,354.48 points to 460,431.50 points to 458,077.02, the JSE Main Index added 1,043.96 points to end at 401,688.56 and the JSE USD market index slipped 1.31 points to end at 221.93.
Trading ended with an exchange of 37,384,823 shares in all markets. The value of stocks traded in the Main and Junior Markets amounts to $398.6 million and the JSE USD market, US$14,833. The market’s PE ratio ended at 27.5 based on 2021-22 earnings and 13.7 times those for 2022-23 at the close of the Jamaica Stock Exchange.
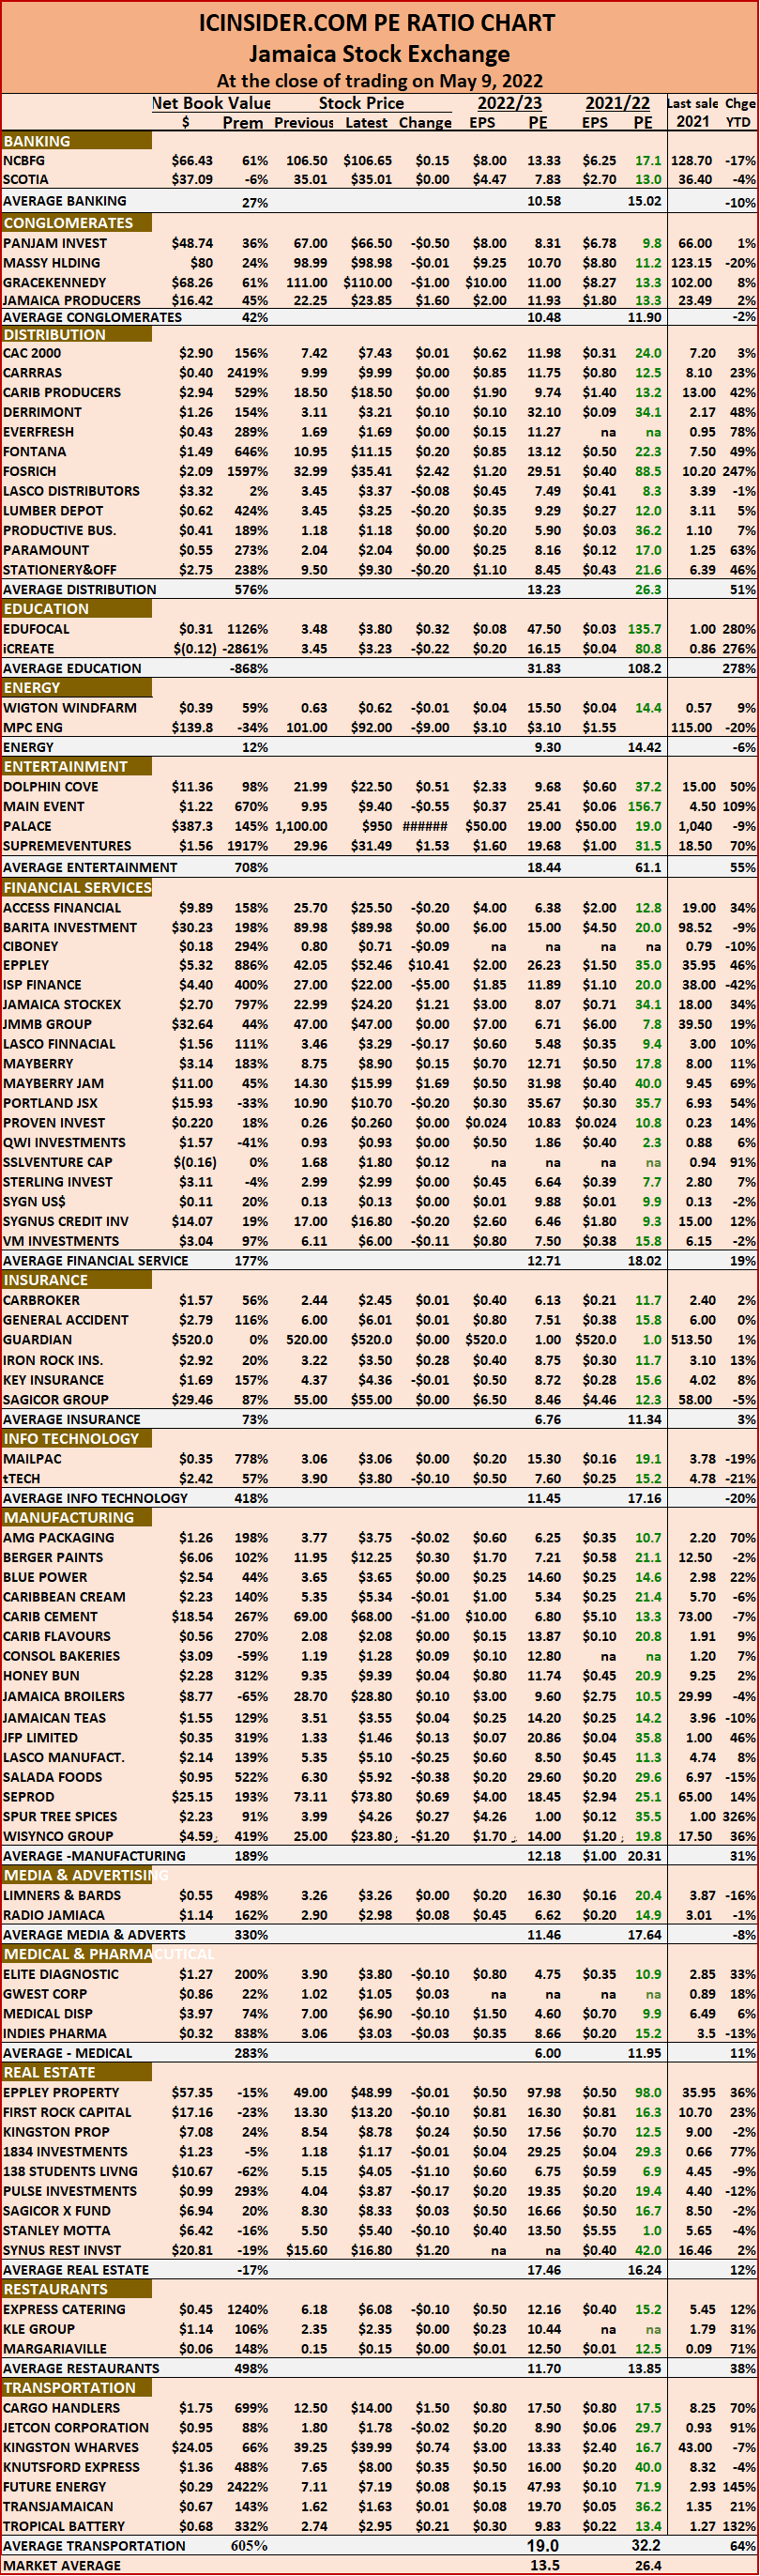
Investors need a series of measures and pertinent information to successfully navigate the many investment choices in the local stock market. The ICInsider.com PE ratio chart and the more detailed daily report charts provide investors with regularly updated information to help with decision-making.
Investors should use the chart to help make rational investment decisions by investing in stocks that are close to the average for the sector and not going too far from it unless there are compelling reasons to do so. This approach helps to take emotions out of the investment decision and put in on fundamentals while at the same time not being too far from the majority of investors. Investors who buy when the price of a stock is close to the average will find that they are not inclined to overpay for a stock.
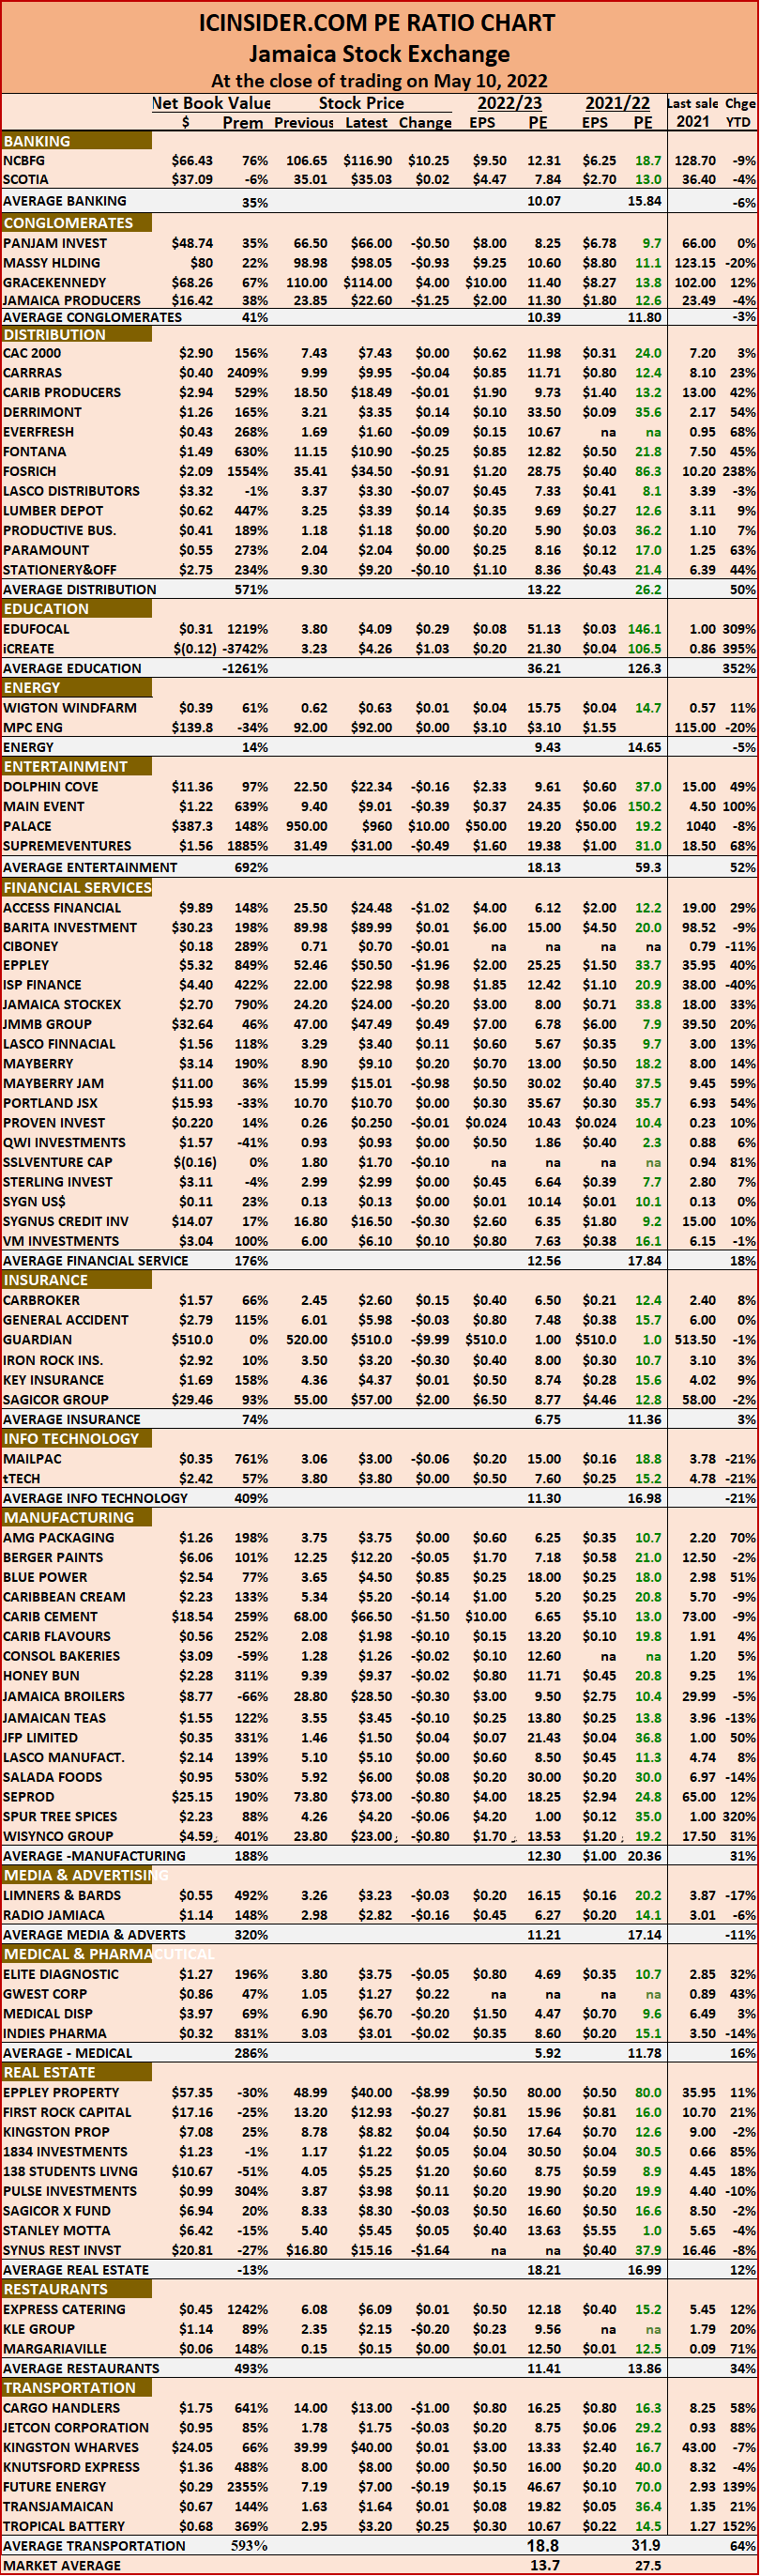 The ICInsider.com PE Ratio chart covers all ordinary shares listed on the Jamaica Stock Exchange. It shows companies grouped on an industry basis, allowing easy comparisons between the same sector companies and the overall market.
The net asset value of each company is reported as a guide to assess the value of stocks based on this measure quickly. The chart also shows daily changes in stock prices and the percentage year to date price movement based on the last traded prices. Dividends payable and yields for each company are shown in the Main and Junior Markets’ daily report charts that show the closing volume for the bids and offers.
The EPS & PE ratios are based on 2021 and 2022 actual or projected earnings, excluding major one off items. The PE Ratio is the most popular measure used to determine the value of stocks.
JSE Main Market slides
Market activity ended on Monday on the Jamaica Stock Exchange Main Market, with the volume of stocks traded rising 33 percent and the value jumping 253 percent over Friday as the market pulled back at the close with falling stocks having the upper hand.
The All Jamaican Composite Index fell 1,039.72 points to settle at 458,077.02, the JSE Main Index fell 1,070.82 points to 400,644.60 and the JSE Financial Index added 0.06 points to settle at 93.39.
 Trading ended with 59 securities compared to 56 on Friday, with 18 rising, 25 declining and 16 ending unchanged. Three stocks ended at 52 weeks’ closing highs, with Eppley closing at $52.46, followed by Jamaica Stock Exchange at $24.20 and Mayberry Jamaican Equities at $15.99.
The PE Ratio, a formula for computing appropriate stock values, averages 15.2. The JSE Main and USD Market PE ratios are computed based on ICInsider.com’s forecasted earnings for companies with financial years ending up to August 2023.
Overall, 14,230,271 shares were exchanged for $381,343,934 versus 10,706,458 units at $108,028,666 on Friday. Productive Business Solutions 9.75% Preference share led trading with 2.88 million shares for 20.2 percent of total volume, followed by Wigton Windfarm with 2.83 million units for 19.9 percent of the day’s trade, Transjamaican Highway with 1.70 million units for 11.9 percent market share and Sagicor Select Manufacturing & Distribution Fund with 1.35 million units for 9.5 percent market share.
Trading averaged 241,191 units at $6,463,457, up from 191,187 shares at $1,929,083 on Friday and month to date, an average of 221,174 units at $4,235,568, compared to 217,015 units at $3,772,732 on the previous trading day. April closed with an average of 532,209 units at $5,709,319.
Investor’s Choice bid-offer indicator shows 12 stocks ended with bids higher than their last selling prices and four with lower offers.
 At the close, Berger Paints increased 30 cents in closing at $12.25 while exchanging 6,586 shares, Caribbean Cement lost $1 to $68 in trading 10,764 stocks, Eppley surged $10.41 to close at a 52 weeks’ high of $52.46, with 10,495 stock units crossing the exchange. GraceKennedy fell $1 to $110 in an exchange of 11,870 units, Jamaica Producers rose $1.60 to end at $23.85, with 36,096 stocks changing hands, Jamaica Stock Exchange popped $1.21 to end at a 52 weeks’ high of $24.20 after 84,268 shares cleared the market. Kingston Wharves rallied 74 cents in closing at $39.99 with the swapping of 40,010 units, Margaritaville climbed $2.50 to $23.50 in exchanging 50 stock units, Mayberry Jamaican Equities advanced $1.69 to close at a 52 weeks’ high of $15.99 with 83,932 shares changing hands. MPC Caribbean Clean Energy declined $9 in ending at $92 trading 19 stocks, 138 Student Living dropped $1.10 to close at $4.05 after exchanging 8,363 units, Palace Amusement shed $150 to end at $950 in switching ownership of 13 stock units. PanJam Investment declined 50 cents to $66.50, with 35,124 stock units crossing the market, Proven Investments fell 45 cents to close at $37.55 with an exchange of 27,947 stocks, Salada Foods lost 38 cents to close at $5.92 after an exchange of 26,538 units.
  Seprod popped 69 cents to $73.80, trading 51,696 shares, Supreme Ventures rallied $1.53 in closing at $31.49 after exchanging 208,360 units, Sygnus Real Estate Finance climbed $1.20 to $16.80 after exchanging 102 stocks and Wisynco Group shed $1.20 to close at $23.80 in trading 330,285 shares.
In the preference segment, Eppley 7.50% preference share dropped 58 cents to end at $6.02 in an exchange of 2,500 stock units.
Prices of securities trading are those for the last transaction of each stock unless otherwise stated.
New Junior Market record close
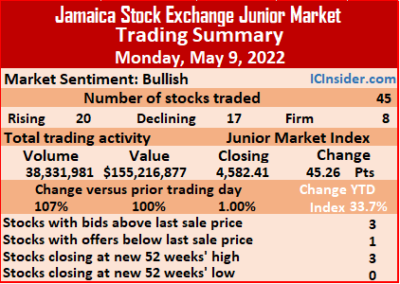
Trading closed on the Jamaica Stock Exchange Junior Market Monday, with the volume of stocks traded more than twice that on Friday with a 107 percent increase after the value jumped 100 percent and resulted in slightly more stocks rising than declining.
 All 45 listed securities traded, up from 44 on Friday, with 20 rising, 17 declining and eight closing unchanged.
The Junior Market Index advanced 45.26 points to a record close of 4,582.41 after the market opened at a record high of 4,613.31, with the market index rising 33.70 percent to date, surpassing the full year gains of 29.75 percent in 2021.
The PE Ratio, a measure in computing appropriate stock values, averages 14. The PE ratios of Junior Market stocks incorporate ICInsider.com projected earnings for companies with financial years closing up to the end of August 2023.
Overall, 38,331,981 shares traded for $155,216,877 up from 18,509,529 units at $77,694,953 on the Friday. Derrimon Trading led with 13.47 million shares for 35.1 percent of total volume, followed by Spur Tree Spices with 10.35 million units for 27 percent of the day’s trade, JFP Limited ended with 3.54 million units for 9.2 percent market share. Tropical Battery closed trading with 2.34 million units for 6.1 percent market share, Lumber Depot contributed 1.46 million units for 3.8 percent market share and EduFocal, 1.31 million units for 3.4 percent market share.
Trading averaged 851,822 shares at $3,449,264 in contrast to 420,671 shares at $1,765,794 on Friday with month to date, averaging 495,602 units at $2,356,219 compared to 420,345 units at $2,125,294 on the previous trading day. April closed with an average of 449,923 units at $1,781,786.
Investor’s Choice bid-offer indicator shows three stocks ending with bids higher than their last selling prices and one with a lower offer.
 At the close, Access Financial shed 20 cents to close at $25.50, with 3,890 shares clearing the market, Cargo Handlers rallied $1.50 to a 52 weeks’ high of $14 in exchanging 44,307 stock units, Derrimon Trading popped 10 cents ending at a 52 weeks’ high of $3.21 after 13,469,757 units crossed the market. Dolphin Cove advanced 51 cents in closing at $22.50 after exchanging 333,111 stocks, EduFocal gained 32 cents to end at $3.80 after an exchange of 1,307,069 shares, Elite Diagnostic declined 10 cents to $3.80, with 400,199 stock units crossing the market. Express Catering fell 10 cents to $6.08 while exchanging 144,623 units, Fontana rose 20 cents in closing at $11.15 with an exchange of 350,945 stocks, Fosrich surged $2.42 to close at a 52 weeks’ high of $35.41, with 508,542 units changing hands after the price hit an all-time high of $38. iCreate dropped 22 cents to end at $3.23 after exchanging 535,733 shares, Iron Rock Insurance climbed 28 cents in ending at $3.50 with the swapping of 2,122 stocks, ISP Finance lost $5 to close at $22 in an exchange of 214 stock units. JFP Limited gained 13 cents to $1.46 in trading 3,542,705 shares, Knutsford Express climbed 35 cents to $8 after trading 8,250 stock units, Lasco Financial dropped 17 cents to end at $3.29 in switching ownership of 209,362 units. Lasco Manufacturing declined 25 cents to $5.10, with 5,444 stocks crossing the exchange, Lumber Depot shed 20 cents in closing at $3.25, trading 1,460,226 stock units, Main Event fell 55 cents to close at $9.40, with 12,026 shares changing hands.
  Medical Disposables lost 10 cents to end at $6.90 after exchanging 12,118 units, Spur Tree Spices increased 27 cents to $4.26, crossing the exchange of 10,348,476 stocks, SSL Venture popped 12 cents ending at $1.80, with 32,701 shares clearing the market. Stationery and Office Supplies declined 20 cents in closing at $9.30, with 6,075 stocks crossing the market, Tropical Battery rallied 21 cents to close at $2.95 in exchanging 2,335,013 units and tTech fell 10 cents to end at $3.80, trading 675 stock units.
Prices of securities trading are those for the last transaction of each stock unless otherwise stated.
Junior Markets 4,582 record close, majors fall
The Junior Market pushed 45.26 points higher in trading on Monday, closing at another record high of 4,582.41 after it traded over the 4,600 points mark for the first time, hitting 4613.27 just after the market opened as fresh results posted since the close on Friday saw investors pushing some stocks higher in response. The Jamaica Stock  Exchange Main Market and US dollar market experienced moderate slippage, with the JSE Combined Index falling 600.65 points to close at 415,781.56.
The All Jamaican Composite Index lost 1,039.71 points to 458,077.02, the JSE Main Index lost 1,070.82 points to end at 400,644.60 and the JSE USD market index slipped 0.48 points to end at 223.24.
Trading ended with an exchange of 52,943,073 shares in all markets. The value of stocks traded in the Main and Junior Markets amounts to $536.6 million and the JSE USD market, US$14,951. The market’s PE ratio ended at 26.4 based on 2021-22 earnings and 13.5 times those for 2022-23 at the close of the Jamaica Stock Exchange.
Investors need a series of measures and pertinent information to successfully navigate the many investment choices in the local stock market. The ICInsider.com PE ratio chart and the more detailed daily report charts provide investors with regularly updated information to help with decision-making.
Investors should use the chart to help make rational investment decisions by investing in stocks that are close to the average for the sector and not going too far from it unless there are compelling reasons to do so. This approach helps to take emotions out of the investment decision and put in on fundamentals while at the same time not being too far from the majority of investors. Investors who buy when the price of a stock is close to the average will find that they are not inclined to overpay for a stock.
 The ICInsider.com PE Ratio chart covers all ordinary shares listed on the Jamaica Stock Exchange. It shows companies grouped on an industry basis, allowing easy comparisons between the same sector companies and the overall market.
The net asset value of each company is reported as a guide to assess the value of stocks based on this measure quickly. The chart also shows daily changes in stock prices and the percentage year to date price movement based on the last traded prices. Dividends payable and yields for each company are shown in the Main and Junior Markets’ daily report charts that show the closing volume for the bids and offers.
The EPS & PE ratios are based on 2021 and 2022 actual or projected earnings, excluding major one off items. The PE Ratio is the most popular measure used to determine the value of stocks.
Profit grows 35% at Wisynco
Profit before Taxation for the March quarter at Wisynco Group jumped $283 million from $813 million for a 34.8 percent increase to $1.1 billion, from the comparative year ago quarter and for the nine months to March, pretax profit climbed $1.2 billion for a 46.4 percent increase to $3.9 billion, up from $2.7 billion in the prior year. After provision for taxes on profit, earnings attributable to stockholders rose 24 percent to $831 million from $673 million earned for the preceding year.

Wisynco ended at $25 on Friday.
The current quarter “includes foreign exchange loss of $35.4 million compared with a $68 million foreign exchange gain for the 2021 quarter,” the directors William and Andrew Mahfood stated in their commentary on the results.
The results equate to earnings per share of 22 cents for the quarter, up from 18 cents in the 2021 quarter and 79 cents, up from 59 cents in 2021 for the nine months. ICInsider.com projects earnings of $1.20 for the year to June or $4.4 billion, with earnings of $1.70 or $6.3 billion in 2023.
The 2022 quarter’s revenues rose 27.8 percent to $9.7 billion, the highest in the company’s history, above the $7.6 billion achieved in the 2021 third quarter. Revenues for the nine months rose at a much slower pace than the current quarter of 20 percent to $28.4 billion, from $23.6 billion in 2021.
“Revenues were driven by strong demand in all product categories and channels. Usually, our Q1 and Q2 Revenue patterns represent our higher earning quarters, however, this Fiscal Q3 trended higher than Fiscal Q1 and Q2, reflecting the anticipated bouncing back of our economy from the Covid measures being relaxed. Additionally, our increased focus on Exports continued driving growth in the channel and we are embarking on additional strategies to continue this trajectory,“ the Mahfoods stated.
The period was not without its challenges. Cost of sales rose 31 percent in the quarter to $6.6 billion resulting in gross profit rising at a much slower pace of 21.6 percent to $3.1 billion from $2.6 billion in the previous year. “Gross Margin at 32.3 percent was 170 basis points lower than the 34 percent for the corresponding quarter in the prior year due mainly to our LNG plant experiencing disruption in energy supply resulting in the company having to spend an additional $81m to purchase electricity,” the directors reported. They went on to state, “additionally, we had production downtime which led to some higher costs of production as well as increased input costs.”

True Juice bottled and distributed by Wisynco.
Selling and Distribution expenses increased 16 percent for the quarter to $1.78 billion from 1.54 billion in 2021 and increased 12.8 percent to $5.2 billion in the nine months from $4.6 billion in 2021. Administrative expenses fell in the latest quarter to $289 million from $339 million in 2021 and slipped slightly to $1.02 billion from $1.03 billion for the nine months. Depreciation fell from $782 million to $718 million for the nine months and taxation jumped 108 percent from $465 million to $957 million and 86 percent from $141 million to $265 million for the quarter.
Gross cash flow brought in $4.3 billion and $3.3 billion after working capital growth and ended at $1.2 billion after investments, addition to fixed assets and paying $1.5 billion in dividends.
But the group remains in robust financial health, with shareholders’ equity of $17 billion and long term borrowings at $1 billion, while short term loans stood at $800 million. Current assets ended at $16 billion, including trade and other receivables of $3.6 billion, and inventories of $3.4 billion, while cash, bank balances, and investments stood at $9.2 billion. Current liabilities ended the period at $5.8 billion and net current assets ended at $10.4 billion.
The stock traded on the Main Market of the Jamaica Stock Exchange at $25 at a PE of just over 20 times earnings and seems to be heading for the mid $30 region over the next twelve months.
Gains for JSE Main Market on Friday
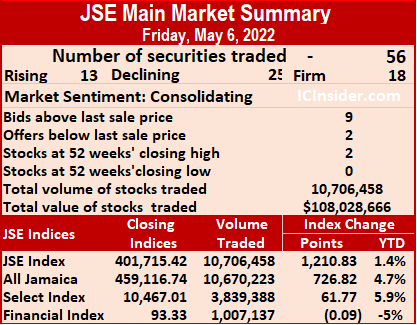
On Friday, investors bought more shares on the Jamaica Stock Exchange Main Market but exchanged slightly less funds than on Thursday, resulting in rising stocks being edged out by stocks declining.
 The All Jamaican Composite Index rallied 726.82 points to settle at 459,116.74, the JSE Main Index added 1,210.82 points to end at 401,715.42 and the JSE Financial Index dipped 0.09 points to settle at 93.33.
A total of 56 securities traded down from 58 on Thursday, with 23 rising, 25 declining and eight ending unchanged.
The PE Ratio, a formula for computing appropriate stock values, averages 15.5. The JSE Main and USD Market PE ratios are computed based on ICInsider.com’s forecasted earnings for companies with financial years ending up to August 2023.
Overall, 10,706,458 shares were traded for $108,028,666 versus 9,854,877 units at $117,634,469 on Thursday. Wigton Windfarm led trading with 2.29 million shares for 21.4 percent of total volume, followed by Transjamaican Highway with 1.96 million units for 18.3 percent of the day’s trade and Sagicor Select Financial Fund 1.26 million units for 11.8 percent market share.
Trading averages 191,187 units at $1,929,083, compared to 169,912 shares at $2,028,180 on Thursday and month to date, an average of 217,015 units at $3,772,732, down from 223,359 units at $4,225,558 on the previous trading day. April closed with an average of 532,209 units at $5,709,319.
Investor’s Choice bid-offer indicator shows nine stocks ended with bids higher than their last selling prices and two with lower offers.
 At the close, Berger Paints rose $1.45 to end at $11.95, with 52,121 shares crossing the exchange, Caribbean Cement lost $1 in closing at $69, trading 10,358 stock units, Eppley Caribbean Property Fund jumped $4 to $49, with 13,702 units crossing the market. GraceKennedy rallied 50 cents to close at $111, with 127,161 stocks changing hands, Guardian Holdings fell $11 in ending at $520 after exchanging 2,194 shares, Jamaica Broilers popped 60 cents in closing at $28.70 after trading 16,277 stock units. Jamaica Producers dropped $1.70 to $22.25 in exchanging 7,694 stocks, Jamaica Stock Exchange shed 96 cents to $22.99 with the swapping of 554,842 units, JMMB Group declined 79 cents to close at $47 after trading 360,914 shares. Key Insurance lost 33 cents to end at $4.37, with 70,828 units clearing the market, Kingston Wharves declined 70 cents in closing at $39.25 while exchanging 5,099 stocks, Mayberry Jamaican Equities climbed $2.11 to close at a 52 weeks’ high of $14.30 in an exchange of 69,072 stock units. NCB Financial shed $2 to $106.50 in switching ownership of 41,032 stocks, Palace Amusement advanced $99.95 to end at $1100 after trading 58 shares, PanJam Investment gained $2.50 in ending at $67 with 47,723 units changing hands. Proven Investments popped 50 cents in closing at $38 in exchanging 30,451 stock units, Sagicor Group fell $2 to $55 with an exchange of 16,409 shares, Scotia Group dropped 44 cents to close at $35.01 after 20,087 stocks crossed the market.
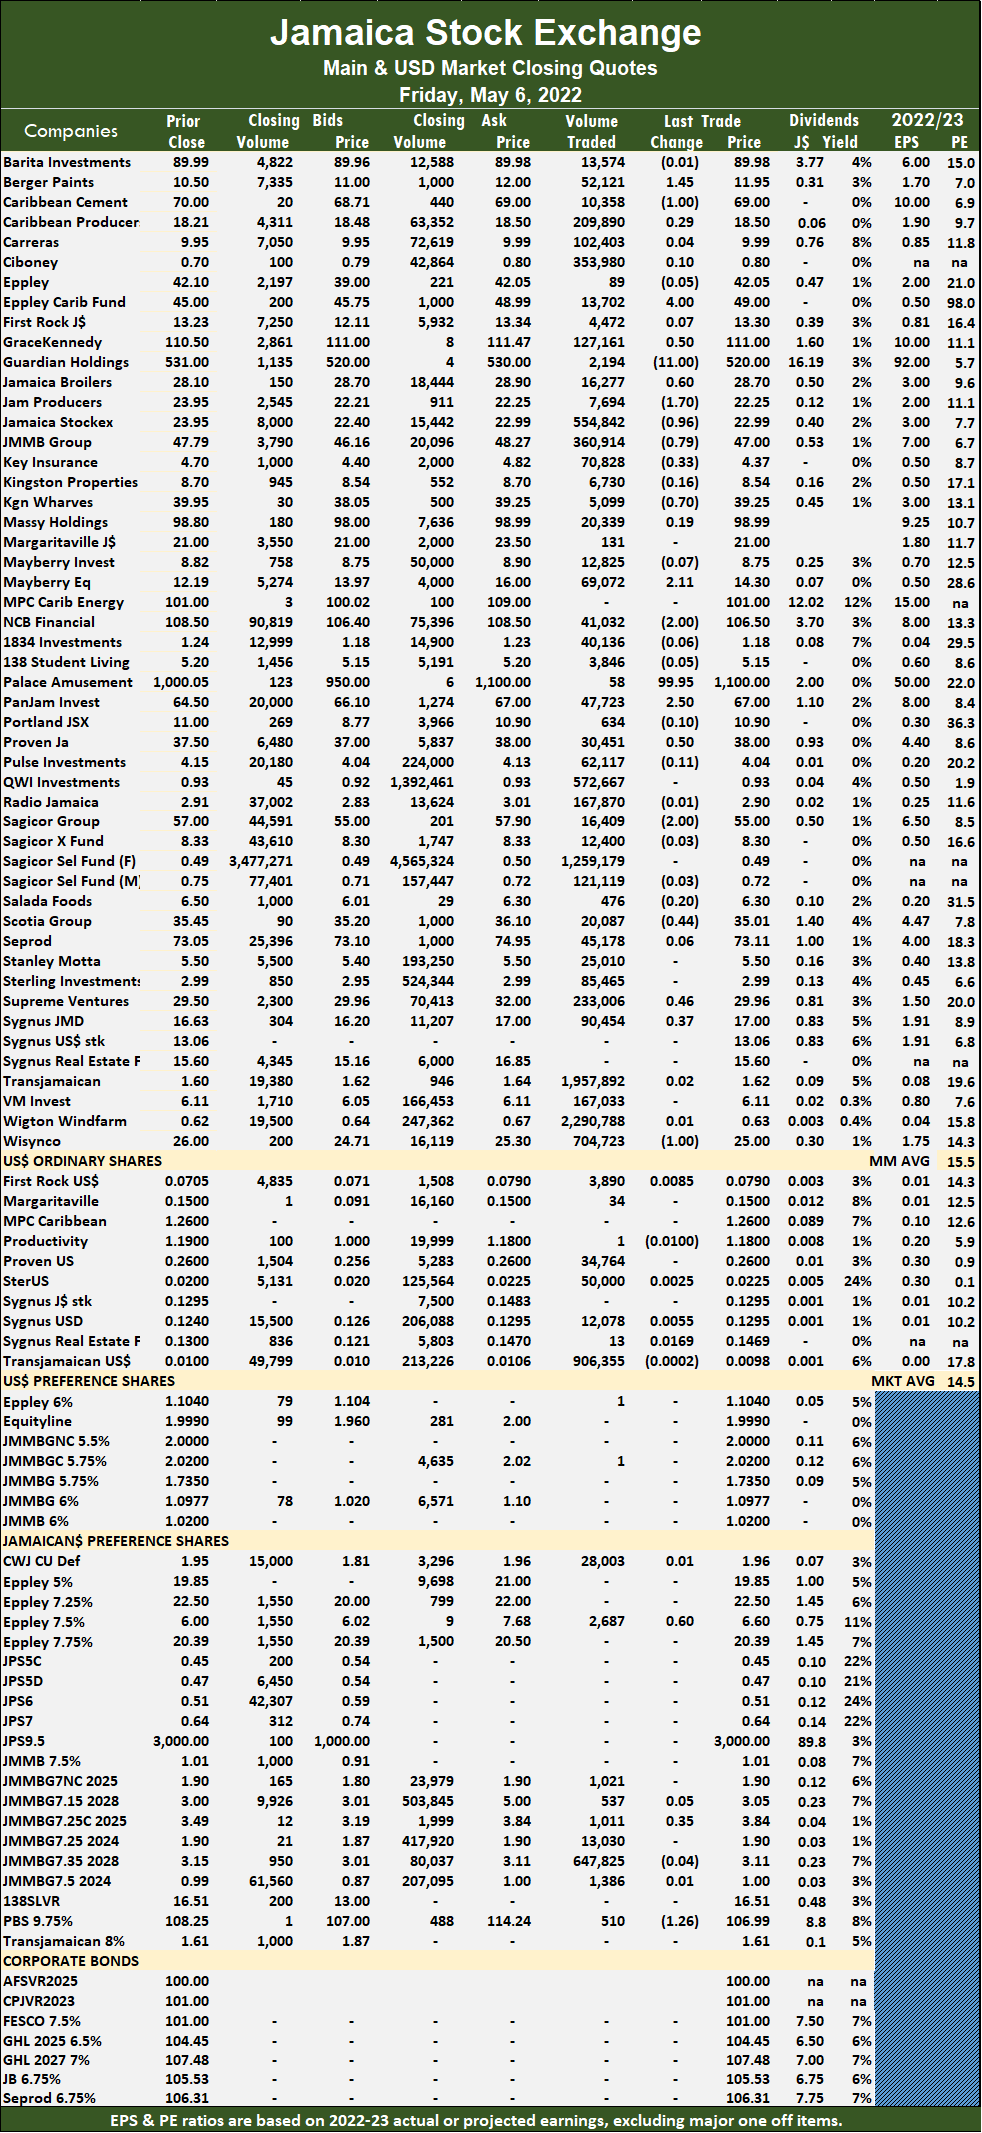 Supreme Ventures rose 46 cents to end at $29.96 in exchanging 233,006 units, Sygnus Credit Investments climbed 37 cents to $17 in switching ownership of 90,454 stock units and Wisynco Group fell $1 to $25 with an exchange of 704,723 units.
In the preference segment, Eppley 7.50% preference share advanced 60 cents to $6.60, trading 2,687 stock units, JMMB Group 7.25% preference share gained 35 cents to end at a 52 weeks’ high of $3.84 while exchanging 1,011 stocks and Productive Business Solutions 9.75% preference share declined $1.26 to $106.99 with the swapping of 510 shares.
Prices of securities trading are those for the last transaction of each stock unless otherwise stated.
More trading for the JSE USD market Friday
Trading on Friday ended with the volume of stocks traded jumping 1,127 percent with a 70 percent value than on Thursday, at the close of the Jamaica Stock Exchange US dollar market, resulting in more stocks rising than falling.
 A total of 10 securities traded, up from seven on Thursday, with four rising, two declining and four ending unchanged.
JSE US Denominated Equities Index rose 0.61 points to end at 223.73.
The PE Ratio, a measure used in computing appropriate stock values, averages 9.4. The PE ratio uses ICInsider.com earnings forecasts for companies with financial years closing up to the end of August 2023.
Overall, 1,007,137 shares traded, for US$21,115, up from 82,057 units at US$12,453 on Thursday. Trading averaged 100,714 units at US$2,111, up from 11,722 shares at US$1,779 on Thursday, with a month to date average of 56,313 shares at US$2,744 versus 43,627 units at US$2,925 on the previous day. April ended with an average of 95,379 units for US$3,929.
Investor’s Choice bid-offer indicator shows one stock ended with a bid higher than the last selling prices and none with a lower offer.
At the close, First Rock Capital USD share advanced 0.85 of one cent to close at 7.9 US cents after exchanging 3,890 shares, Margaritaville remained at 15 US cents in exchanging 34 units, Productive Business Solutions dropped 1 cent to end at US$1.18, with one stock unit clearing the market. Proven Investments finished at 26 US cents trading 34,764 stocks, Sterling Investments rose 0.25 of a cent to 2.25 US cents with an exchange of 50,000 stocks,  Sygnus Credit Investments USD share increased 0.55 of one cent to 12.95 US cents, with 12,078 stock units changing hands. Sygnus Real Estate Finance USD share climbed 1.69 cents to close at 14.69 US cents exchanging 13 units and Transjamaican Highway fell 0.02 of a cent to end at 0.98 of one US cent with the swapping of 906,355 shares.
In the preference segment, Equityline Mortgage Investments preference share ended at US$1.999, after an exchange of just one share and JMMB Group 5.75% ended unchanged at US$2.02 while exchanging one stock unit.
Prices of securities trading are those for the last transaction of each stock unless otherwise stated.
New record close for Junior Market
Rising stocks outpaced those declining by more than two to one at the close of the Jamaica Stock Exchange Junior Market on Friday, as the volume and value of stocks traded rose 40 percent, respectively, over Thursday, with the market closing at a new record high to be up 32.3 percent for 2022 to date.
 The Junior Market Index advanced 5.78 points to settle at a record close of 4,537.15.
The PE Ratio, a measure of computing appropriate stock values, averages 13.8. The PE ratios of Junior Market stocks incorporate ICInsider.com projected earnings for companies with financial years closing up to the end of August 2023.
A total of 44 securities traded up from 42 on Thursday and ended with 28 rising, 13 declining, with three unchanged.
Overall, 18,509,529 shares traded for $77,694,953, up from 13,259,209 units at $55,620,943 on the Thursday. AMG Packaging led trading with 3.34 million shares for 18 percent of total volume, followed by Future Energy Source with 2.53 million units for 13.7 percent of the day’s trade, JFP Limited ended with 1.85 million units for 10 percent market share. EduFocal exchanged 1.52 million units for 8.2 percent market share, Mailpac Group with 1.32 million units for 7.1 percent market share and Lasco Distributors with 1.21 million units for 6.5 percent market share.
 Trading averaged 420,671 shares at $1,765,794 in contrast to 315,695 shares at $1,324,308 on Thursday with month to date, averaging 420,345 units at $2,125,294 versus 420,260 units at $2,218,892 on the previous trading day. April closed with an average of 449,923 units at $1,781,786.
Investor’s Choice bid-offer indicator shows three stocks ended with bids higher than their last selling prices and four stocks with lower offers.
At the close, Access Financial climbed $1.70 to $25.70, with 24,333 shares clearing the market, AMG Packaging rose 17 cents in closing at $3.77 after trading 3,339,123 stocks, CAC 2000 rallied 67 cents to $7.42 in exchanging 110 stock units. Cargo Handlers gained 26 cents to $12.50, with 47,727 units crossing the market, Caribbean Cream rallied 10 cents to close at $5.35, with 170 stock units changing hands, Consolidated Bakeries dropped 16 cents to close at $1.19 after exchanging 333,361 shares. Dolphin Cove popped $1.19 to $21.99 with the swapping of 32,836 stocks, EduFocal rose 18 cents in closing at $3.48 trading 1,520,340 units, Elite Diagnostic lost 65 cents in ending at $3.90 with an exchange of 334,865 shares. Everything Fresh advanced 14 cents to end at $1.69 in an exchange of 106,074 stock units, Future Energy Source declined 29 cents to close at $7.11 with 2,533,969 units changing hands, General Accident shed 15 cents in closing at $6, with 51,195 stocks crossing the exchange. 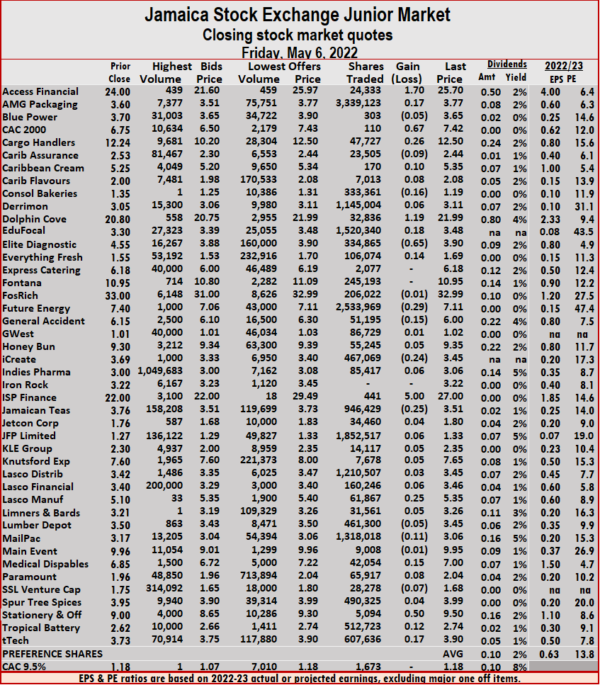 iCreate fell 24 cents to end at $3.45 while exchanging 467,069 stocks, ISP Finance popped $5 to end at $27 in exchanging 441 units, Jamaican Teas declined 25 cents to $3.51 in switching ownership of 946,429 shares. Lasco Manufacturing rose 25 cents to end at $5.35 after 61,867 stock units changed hands, Mailpac Group shed 11 cents to $3.06, with 1,318,018 units crossing the market, Medical Disposables gained 15 cents in ending at $7 after an exchange of 42,054 shares. Stationery and Office Supplies increased 50 cents in closing at $9.50, trading 5,094 stock units, Tropical Battery rallied 12 cents to close at $2.74, with 512,723 stocks crossing the market and tTech climbed 17 cents ending at $3.90, with 607,636 stocks changing hands.
Prices of securities trading are those for the last transaction of each stock unless otherwise stated.
New Junior Market record close of 4,537 as majors rise
The Junior Market squeezed out another closing record high as the week ended on Friday. The market index rose just 5.78 points to close at 4,537.15, as the Jamaica Stock Exchange Main Market and US dollar market enjoyed modest gains at the close. Trading resulted in the JSE Combined Index rising 1,184.96 points to close at 416,382.22.
 The All Jamaican Composite Index rose 726.82 points to 459,116.74, the JSE Main Index added 1,210.82 points to end at 401,715.42 and the JSE USD market index rallied 0.60 points to end at 223.73.
Trading ended with an exchange of 30,223,124 shares in all markets. The value of stocks traded in the Main and Junior markets amounts to $185.7 million and the JSE USD market, US$21,115. The market’s PE ratio ended at 26.4 based on 2021-22 earnings and 13.6 times those for 2022-23 at the close of the Jamaica Stock Exchange.
Investors need a series of measures and pertinent information to successfully navigate the many investment choices in the local stock market. The ICInsider.com PE ratio chart and the more detailed daily report charts provide investors with regularly updated information to help with decision-making.
Investors should use the chart to help make rational investment decisions by investing in stocks that are close to the average for the sector and not going too far from it unless there are compelling reasons to do so. This approach helps to take emotions out of the investment decision and put in on fundamentals while at the same time not being too far from the majority of investors. Investors who buy when the price of a stock is close to the average will find that they are not inclined to overpay for a stock.
The ICInsider.com PE Ratio chart covers all ordinary shares listed on the Jamaica Stock Exchange.  It shows companies grouped on an industry basis, allowing easy comparisons between the same sector companies and the overall market.
The net asset value of each company is reported as a guide to assess the value of stocks based on this measure quickly. The chart also shows daily changes in stock prices and the percentage year to date price movement based on the last traded prices. Dividends payable and yields for each company are shown in the Main and Junior Markets’ daily report charts that show the closing volume for the bids and offers.
The EPS & PE ratios are based on 2021 and 2022 actual or projected earnings, excluding major one off items. The PE Ratio is the most popular measure used to determine the value of stocks.