The Jamaican stock market bounced on Thursday with the market indices moderately higher at the close, with the JSE Combined Index a measure of the overall market, rising 625.49 points to 382,871.73, with the volume and value of stocks traded rising sharply over Wednesday.
 A total of 84,314,052 shares were traded with a value of $266.5 million, versus 16,659,338 shares in the overall market on the prior day. The JSE USD market ended with the value of stocks traded at US$5,629. The day’s trade was bolstered by 61,865,246 units of SSL Venture Capital trading for $202,120,915.
At the close, the All Jamaican Composite Index climbed 543.67 points to 420,869.32, the JSE Main Index rose 480 points to 369,336.69 and the JSE USD market Index slipped 2.01 points to 208.28.
The market’s PE ratio ended at 23.1 based on 2021-22 earnings and 12.4 times those for 2022-23 at the close of trading.
Investors need pertinent information to successfully navigate many investment options in the local stock market. The ICInsider.com PE ratio chart and the more detailed daily report charts provide investors with regularly updated information to help decision-making.
Investors should use the chart to help make rational investment decisions by investing in stocks close to the average for the sector and not going too far from it unless there are compelling reasons to do so. This approach helps to remove emotions from investment decisions and put in on fundamentals while at the same time not being too far from the majority of investors. Investors who buy when the price of a stock is close to the average will find that they are not inclined to overpay for a stock.
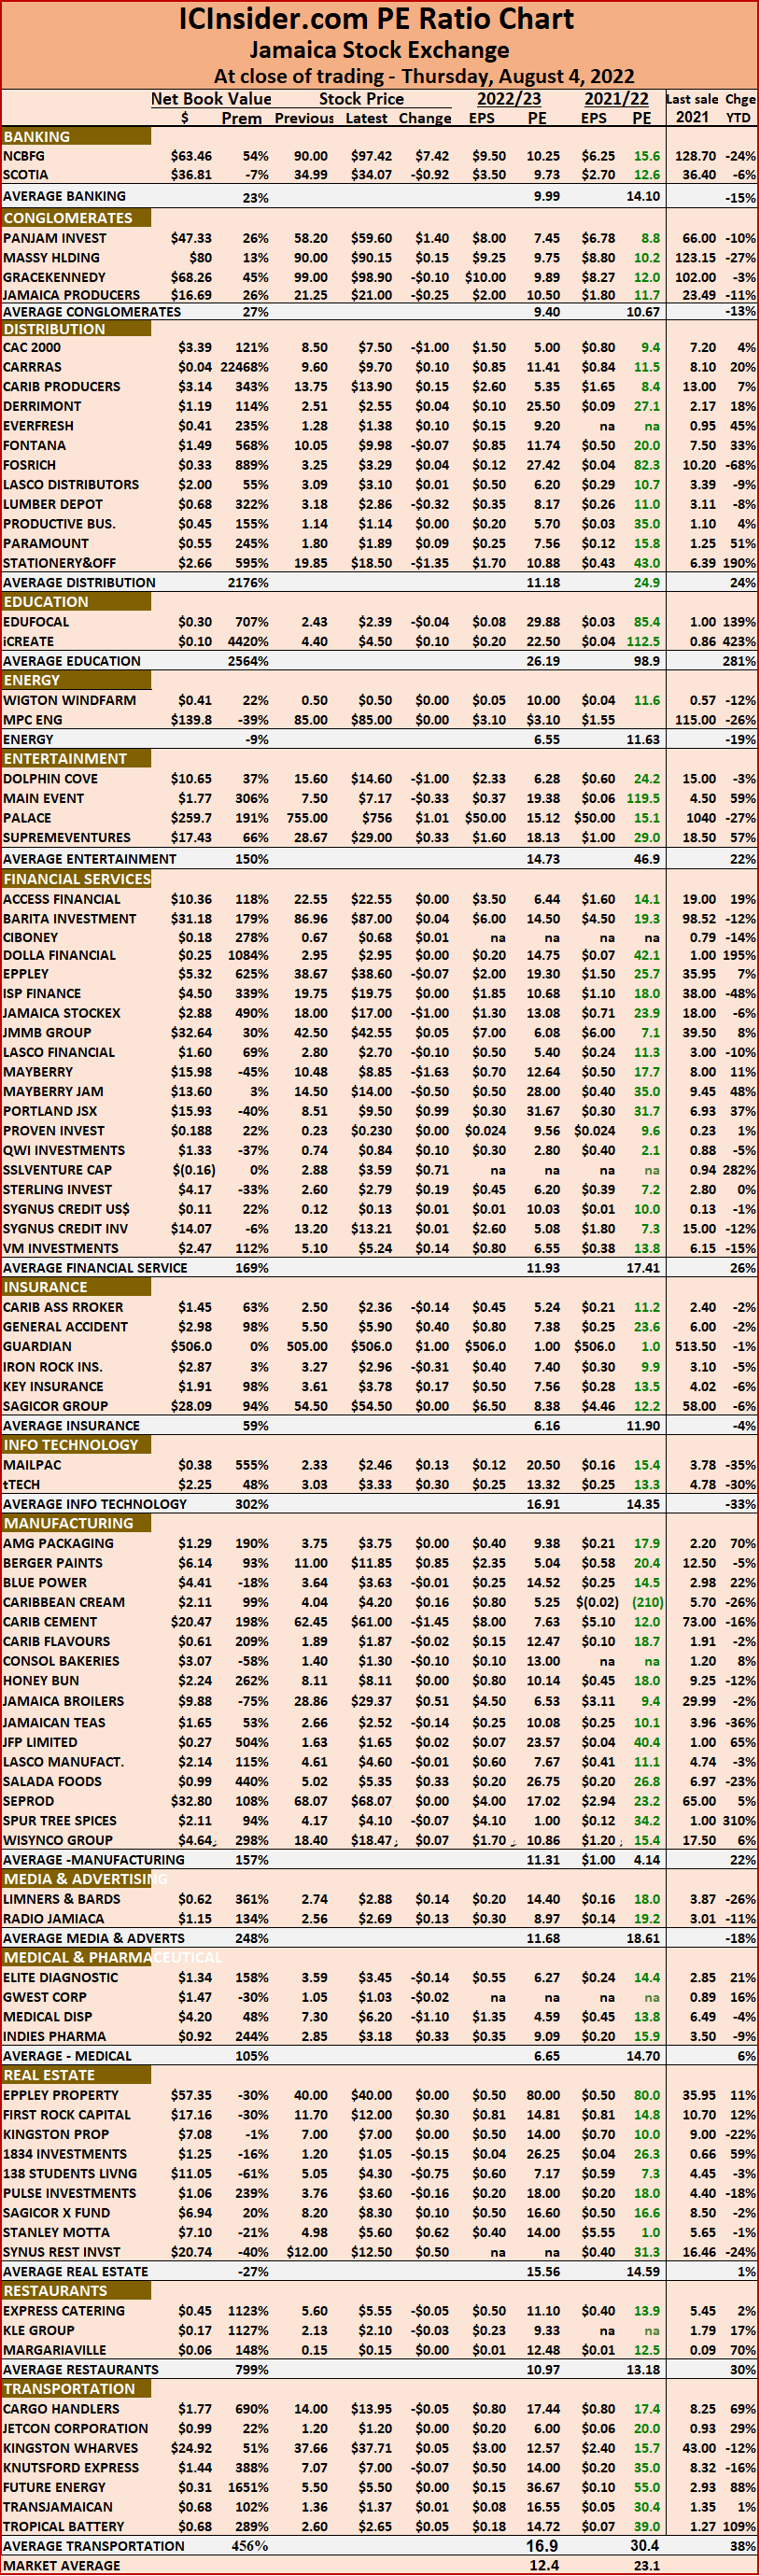 The ICInsider.com PE Ratio chart covers all ordinary shares on the Jamaica Stock Exchange. It shows companies grouped on an industry basis, allowing easy comparisons between the same sector companies and the overall market.
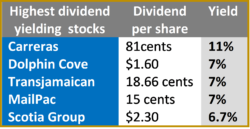
The net asset value of each company is reported as a guide to assess the value of stocks based on this measure quickly. The chart also shows daily changes in stock prices and the percentage year to date price movement based on the last traded prices. Dividends payable and yields for each company are shown in the Main and Junior Markets’ daily report charts that show the closing volume for the bids and offers.
The EPS & PE ratios are based on 2021 and 2022 actual or projected earnings, excluding major one off items. The PE Ratio is the most popular measure used to determine the value of stocks.
SSLVC boost trading on JSE market
August 4, 2022 by